Publisher Market Shares: December 2017
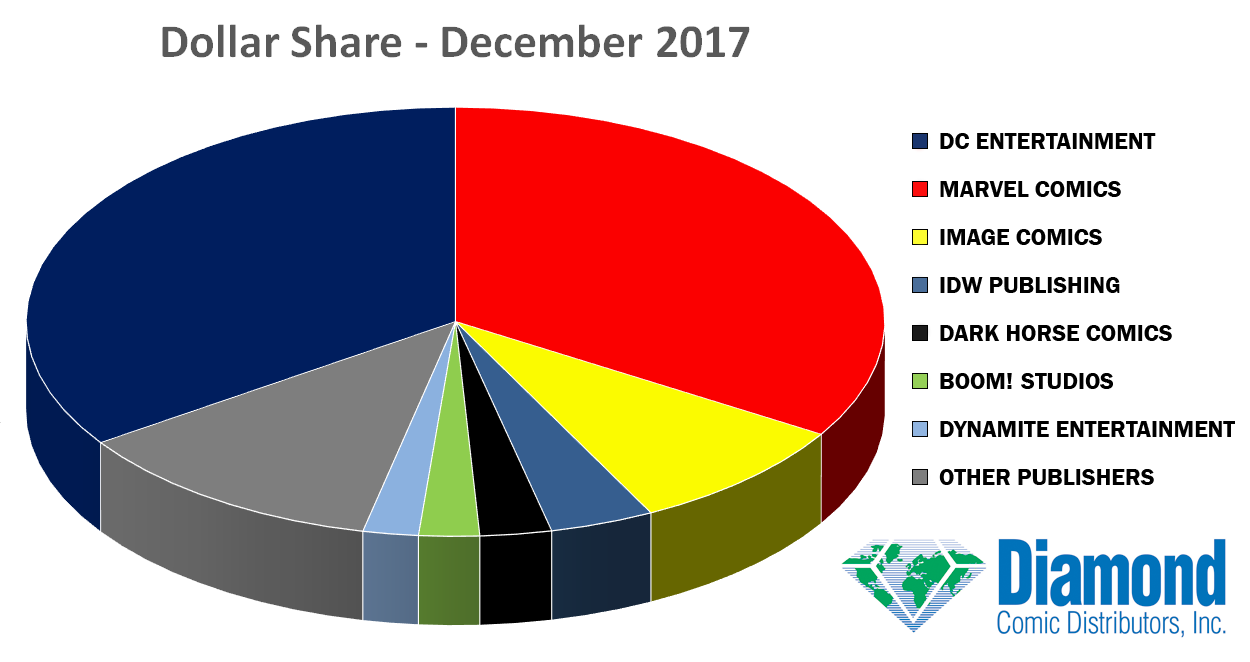
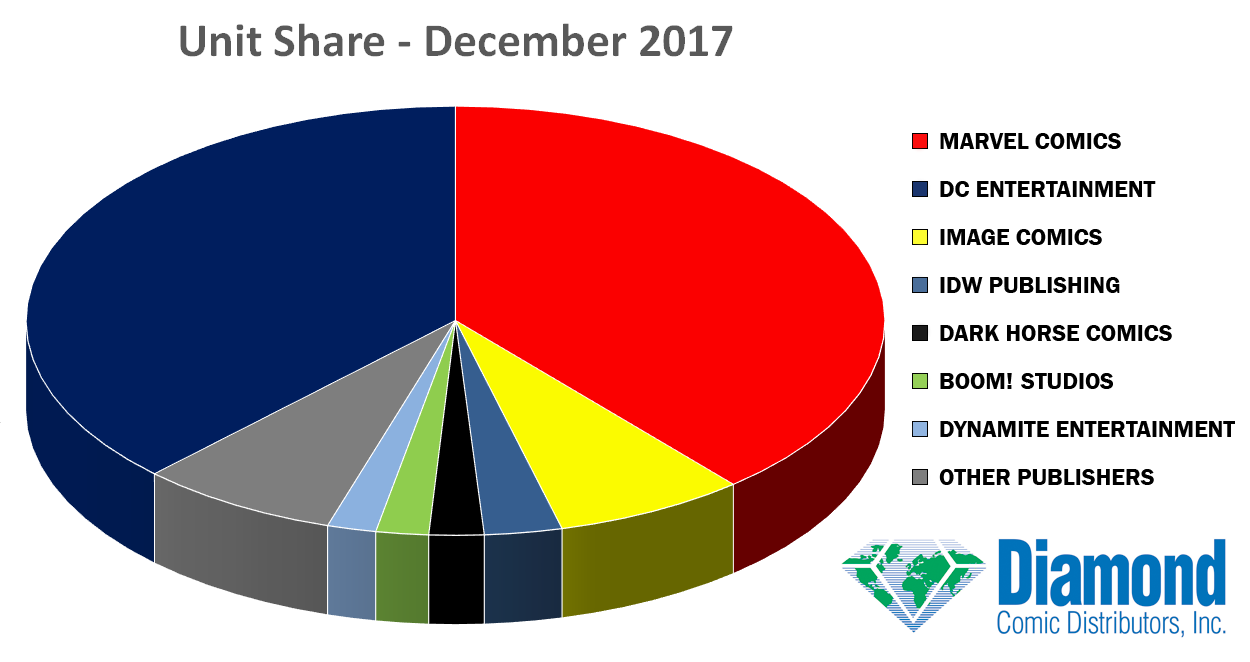
DC Entertainment was the leading publisher in Retail Dollar Share and Marvel Comics was the leading publisher in Unit Share in December 2017, based on total sales of comics, graphic novels and magazines to comic book specialty stores, according to Diamond Comic Distributors.
PUBLISHER MARKET SHARES
Based on Total Unit Sales of Products Invoiced in December 2017
|
|
|||||||||||||||||||||||||||||||||||||||||||||||||||||||||||||||||||||||||||||||||||||||||||||
COMPARATIVE SALES STATISTICS
Based on Total Unit Sales of Products Invoiced in December 2017
| DOLLARS | UNITS | |
| DECEMBER 2017 VS. NOVEMBER 2017 | ||
| COMICS | -16.13% | -14.05% |
| GRAPHIC NOVELS | -21.95% | -10.88% |
| TOTAL COMICS/GN | -18.11% | -13.77% |
| TOYS | -33.23% | -30.05% |
| DECEMBER 2017 VS. DECEMBER 2016 | ||
| COMICS | -16.54% | -24.11% |
| GRAPHIC NOVELS | -10.17% | -13.37% |
| TOTAL COMICS/GN | -14.57% | -23.23% |
| TOYS | -27.60% | -37.11% |
| FOURTH QUARTER 2017 VS. THIRD QUARTER 2017 | ||
| COMICS | -2.41% | -5.19% |
| GRAPHIC NOVELS | 8.49% | 7.61% |
| TOTAL COMICS/GN | 0.82% | -4.24% |
| TOYS | 9.14% | 2.15% |
| FOURTH QUARTER 2017 VS. FOURTH QUARTER 2016 | ||
| COMICS | -13.90% | -19.53% |
| GRAPHIC NOVELS | -1.77% | -7.71% |
| TOTAL COMICS/GN | -10.37% | -18.66% |
| TOYS | -15.67% | -24.40% |
| YEAR 2017 VS. YEAR 2016 | ||
| COMICS | -10.40% | -9.69% |
| GRAPHIC NOVELS | -9.38% | -11.86% |
| TOTAL COMICS/GN | -10.09% | -9.86% |
| TOYS | -12.55% | -19.90% |
NEW TITLES SHIPPED
Based on Total Unit Sales of Products Invoiced in December 2017
| PUBLISHER | COMICS SHIPPED | GRAPHIC NOVELS SHIPPED | MAGAZINES SHIPPED | TOTAL SHIPPED |
| MARVEL COMICS | 85 | 43 | 0 | 128 |
| DC ENTERTAINMENT | 80 | 38 | 1 | 119 |
| IDW PUBLISHING | 35 | 32 | 0 | 67 |
| IMAGE COMICS | 55 | 10 | 0 | 65 |
| BOOM! STUDIOS | 24 | 7 | 0 | 31 |
| DARK HORSE COMICS | 19 | 9 | 0 | 28 |
| DYNAMITE ENTERTAINMENT | 21 | 5 | 0 | 26 |
| VIZ MEDIA | 0 | 16 | 0 | 16 |
| VALIANT ENTERTAINMENT | 6 | 2 | 0 | 8 |
| ONI PRESS | 4 | 3 | 0 | 7 |
| OTHER NON-TOP 10 | 118 | 164 | 27 | 309 |
| TOTAL | 447 | 329 | 28 | 804 |
 |
| Dollar Market Share – December 2017 |
 |
| Unit Market Share – December 2017 |
How does Diamond calculate the charts? It all starts at the comic book shop.
Data for Diamond’s sales charts — which includes the monthly market shares and all top product charts — are compiled by Diamond Comic Distributors from sales made to thousands of comic book specialty shops located in North America and around the world. Additional sales made to online merchants and other specialty retailers may be included as well.
Unit and dollar market shares are calculated based upon orders for comic books, graphic novels, and magazines invoiced and shipped to Diamond customers during any given month, which comprises pre-orders, advance reorders, and reorders, minus any copies that are received back from a title marked as returnable. Please note that comics marked with an asterisk (*) have had their reported quantities reduced due to retailer returnability, and thus may rank lower on the charts than their actual sales would reflect.
The New Titles Count Chart includes all titles that were invoiced by Diamond to retailers for the first time during the month and is not the official solicited title count for the month. Variant edition comic books and graphic novels at the same price point count as a single SKU. Variant edition comic books, lenticular covers, digital combo packs, and graphic novels at different price points count as separate SKUs for each edition.
***
ABOUT DIAMOND COMIC DISTRIBUTORS (DCD) — Diamond is at the nexus of comics and pop culture merchandise. Based in Baltimore, MD, DCD is the world's largest distributor of English-language comic books and pop-culture related merchandise, servicing thousands of specialty retailers worldwide. For more information, visit Diamond on the web at www.diamondcomics.com.
© 2017 Diamond Comic Distributors, Inc. All rights reserved.


